Course Evaluations
Resource Overview
What you need to know to make the most of the student course evaluation process
Effective Evaluations
How can you make the most out of student course evaluations?
At WashU, course evaluations are administered by the Office of the Registrar in partnership with individual schools and programs. Details about the logistics of course evaluations can be found at WashU Course Evals. This includes the login to your Course Evaluation Dashboard, contact information for school/program eval administrators, and answers to frequently asked questions.
But there’s more to course evaluations than just the logistics of their administration. Below you can find advice and tips for designing your own custom questions (Question Personalization), encouraging students to complete evaluations, and interpreting the results when they come in.
We also offer confidential on-on-one consultations on the entire course evaluation process, from Question Personalization to using student feedback effectively.
Question Personalization
- Logistics
-
- Instructors can add up to 3 customized questions to each of their courses. These questions can be used to gather information on aspects of your course that are not covered by your school or program’s standard evaluation questions. There are several pre-defined question types based on matching the question formats of each school.
- This “Question Personalization” period for most semester-long courses begins 11 days before evaluations are opened to students and lasts for one week.
- You will get an email when the QP period begins that lets you know the exact dates this option is available for your course.
- Further logistical details are available at WashU Course Evals.
- Deciding what to ask
-
- Remember, QP is optional; you don’t HAVE to ask anything.
- If you do decide to ask your own questions, return to your course’s learning goals. Consider asking questions related to the learning goals that are most important to the course..
- Consider asking about about aspects of your course that your program or department’s standard questions don’t cover.
- Focus on student experience, not asking students to directly rate the quality of parts of the course, as this can help reduce potential bias. For example, instead of asking whether a lecture on a difficult topic was well-designed, ask if students felt they understood the material better after the lecture.
- Ask questions where the answer might change how you do something in the course. If you think of a question but potential student responses might not be able to guide you in making changes, you may want to reconsider the question.
- Open vs. Closed Questions
-
You can ask either open or closed questions in QP.
Open questions:
- Respondents type in text.
- E.g. “What did you find useful about our Friday review sessions?”
- Open questions are good for getting at details and learning things you might not have thought to ask about in a closed question.
- BUT, many respondents skip open questions, the answers can be difficult to interpret, and analyzing the answers can be time consuming for larger classes.
Closed questions:
- Respondents select an option from the choices provided (i.e. multiple choice).
- E.g. “To what extent do you agree or disagree with the following statement? ‘The two-stage exam helped me learn.'”
Strongly agree / Agree / Neither agree nor disagree / Disagree / Strongly Disagree
- E.g. “To what extent do you agree or disagree with the following statement? ‘The two-stage exam helped me learn.'”
- Closed questions are easier to analyze than open questions, and students are more likely to respond.
- BUT, responses to closed questions have less depth than open questions, and do not always provide enough context to make effective change.
In sum, balance the size of your class and your goals in deciding whether to ask open or closed questions. If you have a smaller class, you might want to ask more open questions to help you gather in-depth feedback. If your class is larger, using more closed questions could help you get a general overview of what you’re interested in from your students’ perspectives. You can also schedule a consult with the CTL or send us draft versions of questions for feedback as well.
- Respondents type in text.
- Question Writing Tips
-
Below are some suggestions to keep in mind as you write your custom questions.
Be clearer than you think you need to be
When designing questions, avoid ambiguities in either the question and/or answers that might lead different people to interpret the items differently.
Less clear:
“I did the reading.”
1 – 7 (Strongly disagree – Strongly agree)
Better:
“I always read the assigned reading completely.”
1 – 7 (Strongly disagree – Strongly agree)
Avoid leading questions
Check your questions to make sure that they don’t accidently push respondents to answer a certain way.
Leading:
“In the past, most students have usually enjoyed the visit to the library archives. How would you rate the quality of this semester’s archives visit?”
1 – 5 (Poor – Excellent)
Better:
“How would you rate the quality of this semester’s archives visit?”
1 – 5 (Poor – Excellent)
Avoid asking two questions at once (aka “double-barreled” questions)
Double-barreled:
“The lectures and readings helped me learn.”
1 – 5 (Strongly disagree – Strongly agree)
Better:
“The lectures helped me learn.”
1 – 5 (Strongly disagree – Strongly agree)
“The readings helped me learn.”
1 – 5 (Strongly disagree – Strongly agree)
Make sure answers to closed questions are appropriate
Unmatched and unbalanced:
“The assignments helped me learn.”
1 – 5 (Poor – Excellent)
Better:
“The assignments helped me learn.”
1 – 5 (Strongly disagree – Strongly agree)
These suggestions for writing questions are loosely based on tips from Bryman (2016).
Encouraging Student Response
- Talk about evals
-
- Students do not necessarily understand the impact, if any, their completing course evaluations will have (Hoel and Dahl 2019).
- It’s therefore important to explain why course evaluations are meaningful to you. Showing students that you care about course evaluations can increase response rates (Chapman and Joines 2017).
- Also tell students what you plan to do with the results. If you’ve made changes to your courses in the past based on student feedback, tell them that too.
- Describe how low response rates hurt your ability to make changes, by making it harder to figure out what is working and what isn’t in the course.
- Mention evaluations more than once. You can also re-send the course evaluation invitation to students who have not yet completed their evaluation of your course. Instructions can be found on the Office of the University Registrar’s Course Evaluation page (scroll down to “Subject Management” under “Faculty and Staff Resources”).
- Give time to complete in class
-
- Consider reserving class time for students to complete their evals on their devices.
- The beginning of class works better for this than the end (Standish et al 2018).
- Provide the link to the evals portal in case your students have misplaced their evaluation email.
- Consider Incentivizing Response
-
- You can see the class response rate when the evaluation period is still open. (Although you cannot see which individual students have and have not completed their evaluations.)
- This information can be used to create class incentives:
- If [blank]% of students complete their evals by [a certain date] then everyone gets an extra credit point / class let out early / later due date on the final paper / etc.
- Class incentives, even when small, have been shown to increase student response rates (Boysen 2016).
- Demonstrate you care what your students think
-
- Ask for feedback from your students throughout the semester.
- Demonstrate that you take it seriously.
- Evidence suggests instructors who ask for mid-semester feedback may get higher responses on end-of-semester evals (Stanny and Arruda 2017).
Interpreting Results
- Steps for Responding to Student Feedback
-
It can be helpful to approach responding to course evaluations as a series of steps. When doing so, keep in mind that student course evaluations are surveys of students’ experiences, not direct measures of teaching quality.
- Reflect on Your Course: Before reading your evaluations, reflect on how your course went from your perspective. What worked well? What worked less well? What are you unsure about?
- Read and React: Look at your collected scores and student comments, then allow yourself to have an emotional reaction – good or bad – in response to the data. Reading evaluations can be stressful, and that’s okay. As described below, focus on patterns in the evaluations over outliers.
- Relax: Take a break. Some people like to leave their evaluations alone for a day or two, others for a week or more. Process your emotions so that you can come back to the data later with a fresh, more objective perspective.
- Revisit: Return to your evaluations and process them with a view to understanding your students’ perceptions and experiences in your class. Suggestions for how to do so can be found in the sections below.
- Respond: After you have a good understanding of what can be learned from the evaluations, make decisions about what you will and will not change in your courses and teaching. Write some notes for yourself to file alongside your course materials, so that you can remember what you would like to incorporate and/or change in the future.
(Steps and their descriptions adapted from “Interpreting and Responding to Student Evaluations of Teaching.”)
- Interpreting Quantitative Items
-
When interpreting the numerical scales in your evaluations consider the following.
- Consider how many students responded: There’s no definitive guide to how many responses you need for the results to be valid, although more responses is always better than fewer responses. Generally, larger courses (>50) can get away with a lower percentage of students responding than smaller courses. A 25% response rate might provide valid results for a class with 100 students, but is unlikely to do so in a class with only 10 students (Chapman and Joines 2017). The fewer responses you have the more you should take your results with a grain of salt, as they may not be representative of the class as a whole.
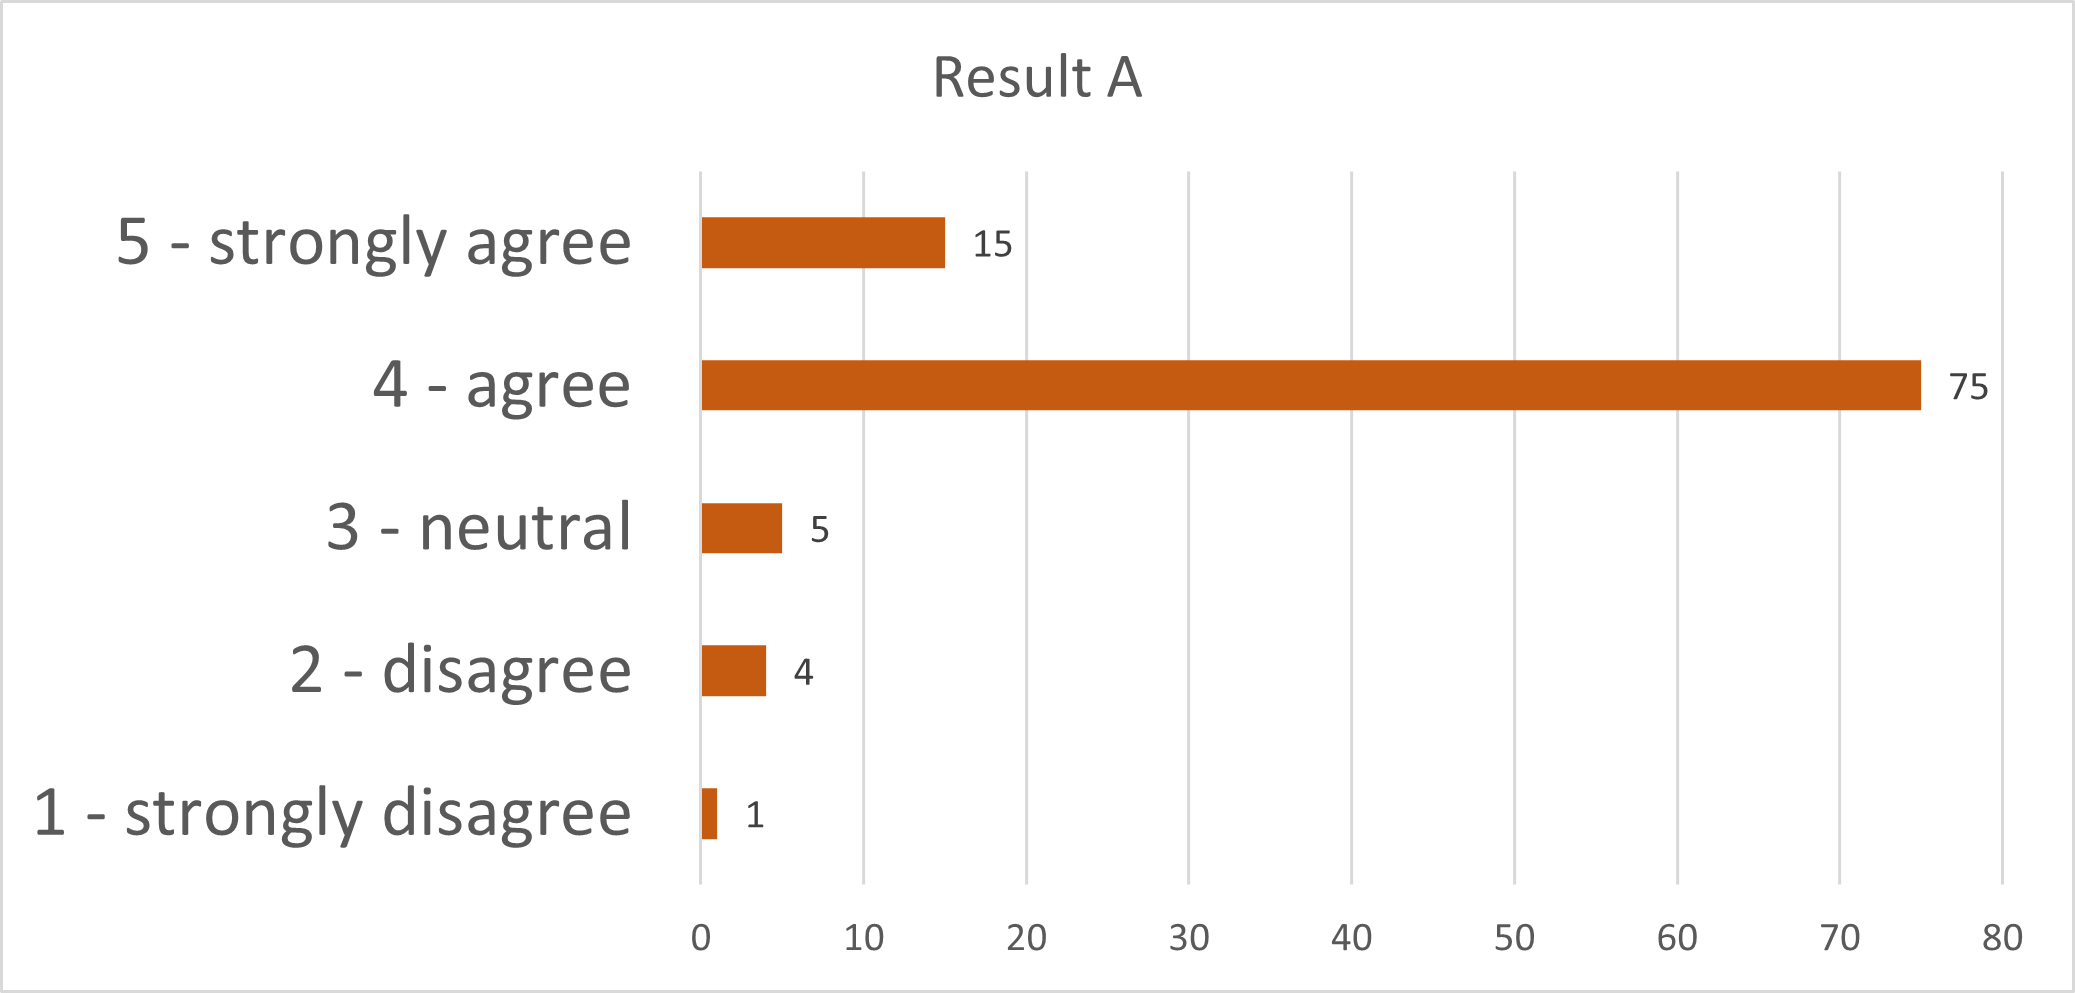
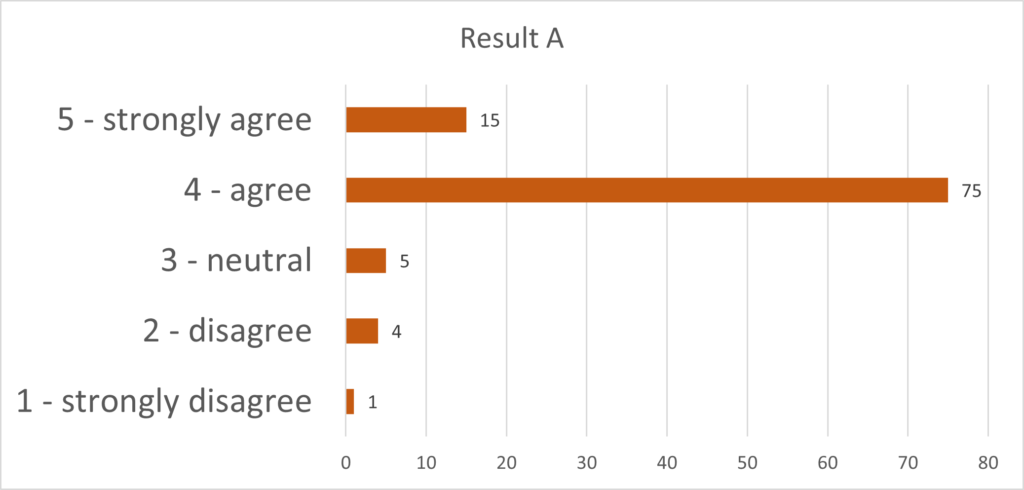
- Focus on the distribution not the averages: Average (mean) scores can be misleading for several reasons. For example, the graphs below show hypothetical responses to the question “I have learned something which I consider valuable.” Both graphs have a mean score of 4, but each tells a very different story. In Result A, most students strongly agreed or agreed with the statement that they learned something valuable. In Result B, even more students strongly agreed, but a significant minority of students strongly disagreed with the statement. This suggests a difference of opinion is present in the class that may be important to address. In addition, in this type of question, it’s unclear whether or not the “distance” between each number on the scale is equal in the minds of the students who respond. For example, selecting agree is not twice as much “agreement” as selecting disagree, even though numerically on this scale that is the case. It’s therefore much better to examine how many students answered at each option than to read a lot into average scores. For example, in Result B, noting that 73 students expressed agreement and 23 expressed disagreement that they learned something valuable tells us more useful and actionable information than noting that the mean value is “4.”
Click to enlarge 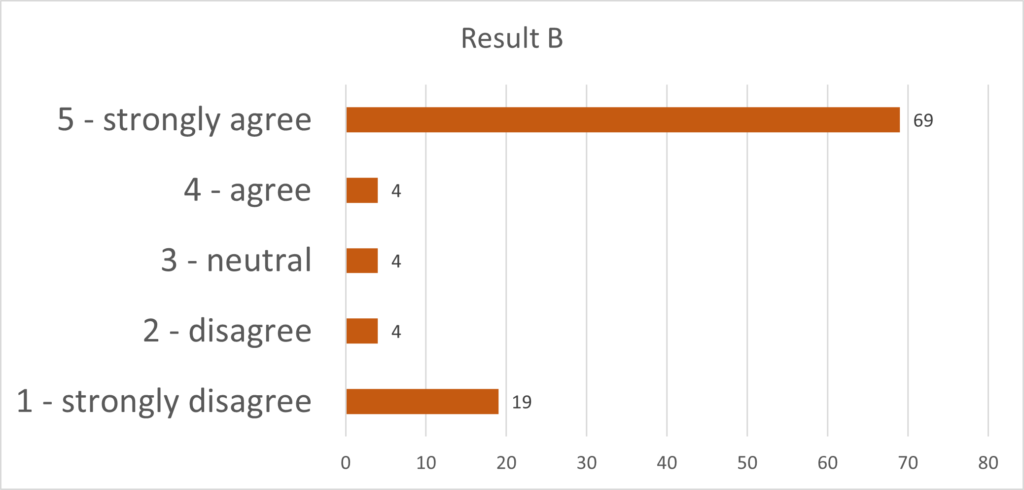
Click to enlarge - Interpret alongside the qualitative results: Answers to qualitative questions can help explain why students may have answered quantitative answers in a certain way. In Result B above, for example, answers to the open qualitative questions could shed light on why some students felt that they did not learn something useful in the class.
- Be wary of comparisons to others: The kinds of questions asked in course evaluations do not lend themselves to easy comparisons between courses or instructors. Different courses may receive different ratings because of the students enrolled (e.g. majors/non-majors), subject matter, and other characteristics not directly related to an instructor’s teaching. Comparing instructors to one another also can bring potential issues of bias into play (Linse 2017). However, if you have taught the same course before, it can be useful to compare your scores to other times you have taught the course in order to examine any changes over time.
- Remember that small differences may not mean anything: If you are comparing your results to past times you have taught a course, or if you happen to notice how your mean scores compare to other instructors’ scores in some of the summary data provided, keep in mind that small differences between scores may not actually have any real meaning. Without performing statistical tests requiring access to score distributions, it is not possible to say if a difference in scores is reflective of an actual difference in student opinion or if it is likely due to chance. Studies have shown that many faculty often overinterpret small differences in course evaluation ratings that are not statistically significant (Boysen et al 2014; Boysen 2015; Boysen 2017). Therefore, be very careful in drawing conclusions from minor differences in ratings.
- Interpreting Qualitative Items
-
Interpreting qualitative answers in course evaluations can be difficult, but the suggestions below may help you get started.
- Look for patterns: It’s easy to focus on positive or negative comments that stand out from the rest. More useful, however, is to examine any patterns that you can discover. Several students writing similar responses may be evidence of wider agreement on an issue. At the same time, comments that disagree with one another can also point to areas where student experience varies; such variation may signal an area to address in the future. Of course, you might not always be able to find identifiable patterns in your course evaluation data. When you can, however, it is usually a more valid indicator of student experience than a non-representative comment made by a single person.
- Sorting answers may help: Finding patterns and making sense of qualitative data is not always easy, especially if you have more than just a few responses. One method is to copy and paste the qualitative answers into another program (e.g. Excel, Word, etc.) where you can sort them into categories that are helpful to you. There is no one right sorting strategy for everyone and you should choose the one that works best for you. One idea is to sort responses into “Positive comments” “Actionable suggestions,” “Nonactionable suggestions,” and “Comments unrelated to teaching and learning.” Another sorting scheme is to place responses in a table where you list categories in rows (e.g. “Classroom activities,” “Course structure,” “Grading,” etc.) and list columns labeled “Positive” and “Challenges.”
- Interpret alongside the quantitative results: Look at how comments support or differ from the quantitative ratings you received. This can give you more context on whether or not a few positive or negative statements are possible outliers.
- Extremely negative comments: One of the most difficult things to deal with in student evaluations are comments that may be extremely negative, insensitive, and/or inappropriate.
- Keep perspective: It’s easy to fall into the trap of concentrating on one or two negative comments even when the vast majority of feedback is positive. Also, remember that student evaluations are just one imprecise measure of what happens in your course. They can offer useful feedback but do not define you or your teaching, whether they are positive or negative.
- Remember they were anonymous: It is easier for people to write harsher and insensitive feedback when it is anonymous. Students may not have communicated their opinions in the same way were that not the case.
- Comments may reflect broader issues: Extremely negative comments in course evaluations can also reflect issues beyond those having to do with an individual instructor (e.g. frustrations with the curriculum, etc.).
- Focus on what’s useful from evaluations: In the end, focus on what’s useful to you in evaluations that can help you improving your teaching and your students’ learning.
- Applying Lessons Learned
-
After you feel that you understand what your course evaluations are saying, it is time to consider how to apply that information to your teaching.
- Decide what feedback is actionable: Some feedback may suggest changes you are able and willing to make to your teaching, but other feedback might be related to areas that you cannot or are not willing to change for pedagogical reasons. If you have not already done so, decide which feedback concerns aspects of your course you are able to change.
- Tackle easy fixes first: Sometimes there may be items that are easy to fix, such as the organization of readings on Canvas or the size of your handwriting on the whiteboard during lectures. If you find some of those in your course evaluations, you may want to address them first.
- Don’t have to do everything at once: It’s often best to make incremental changes in your courses instead of trying to improve everything at once. If your course evaluations give you multiple ideas for larger areas you want to work on in your course, you don’t have to do it all the next time that you teach it.
- Consider feedback applicable to multiple courses: Sometimes feedback isn’t only applicable to the course that you just taught, but can also apply to your teaching more generally.
- Make notes about what you found: It can be helpful to make notes about what you learned from your course evaluations, especially if you’re not teaching the course again right away.
- File your evaluations: Download your evaluations as a pdf and file them in a folder on your computer so you have all of your course evaluations in a central location. This can be useful when working on tenure and promotion materials, or if you are on the academic job market.
- Reach out to the CTL: We’re available for consultations on how to bring new ideas into your course, brainstorming ways to implement changes, or even just chatting about how best to use your course evaluations. Schedule a consult today!