Reflections of a CTL Fellow: Jayde Homer, PhD
Written by Jayde Homer, CTL Fellow and PhD in Psychological & Brain Sciences

In this blog post, I’m going to reflect on my experience as a data fellow for the Center for Teaching and Learning at Washington University. My goal was to share my journey and help others who may be interested in pursuing such fellowships or wish to learn more about alternative work in academia/higher ed beyond professorships.
Before
I applied in the first round when CTL opened up an Ed Tech fellow position in December of 2021. The interview process was a nice way to practice professional communication and communicating findings of a brief data task. First, I shared my CV and cover letter. During a brief phone interview, I answered questions about my experiences and goals, and why I would be a good fit for this position. Then, I a data task and shared my findings. After all of that, I was not offered a position due to funding, not skill. Rejection sucks. What did I do? Carried on grad studenting. Which ended up being a good thing because I had a very busy semester!
I reached back out in April 2022 to see how things were going and by the end of April had a meeting set up with the Assistant Director for Education Technology. Turned out that chat was actually an interview, so that was a good reminder to treat everything as an interview. We met and then I did another very similar data task for a different tool (which you can find more details about at the end of this blog!).
Then I was offered the position! Funding was limited so I didn’t negotiate, but I generally recommend doing so. It’s tricky in lower/intern-level positions, but worth a shot. I started during summer semester 2022. During that time, I was also working on my dissertation proposal, which I successfully defended in August of 2022. Balancing the two separate roles was tough but a great taste of what being an academic feels like!
There was a contract, which I should’ve printed out. I’m looking at it now and thinking about how the role has changed. Feel free to contact me or the CTL for a copy (ctl@wustl.edu). When things get hard or you kinda forget what it is you’re supposed to be doing or why you started in the first place, it might be good to have that contract handy so you can see the bigger picture goal of what you’re contributing to.
During
The contract stated:
Complete work outlined in Data Project Plan below, through the following tasks:
- Collect, analyze, and synthesize data from WashU-supported educational technology tools
- Identify data gaps and develop metrics for assessing usage across platforms,
- Present relevant findings and recommendations to improve data analytics,
- Write a report of findings and descriptions of methods utilized throughout this project,
- Meet weekly with mentor, and occasionally with partners at WashU to provide project updates, receive feedback, and brainstorm next steps.
For the most part, that’s exactly what I did! Beginning in Summer 2022, I tried to put in the committed 10 hours per week. After the summer, I was fortunate to have funding secured to keep me on the project. There were so many things to do and apparently just me to do it all!
But what determined what I did and when? Sometimes there were upcoming contract renewals or specific things that people/admin wanted to know about. In those cases, I dug through the relevant data and prepared a report. Having my mentor as a first-pass sounding wall was great. Sally, with her experience and research with “good graphs” has given me so much advice and development on effective graphs and communicating data to wide audiences. What is the goal of a graph? What do you want them to take away from it? If a stranger had ten seconds to look at the graph and write a one-sentence takeaway, what would they write? Is that what you want them to say?
When I didn’t have a specific report to work on, things got a little tricky personally. I found that without a deadline or hard goal, driving my own projects was challenging, especially as a graduate student with 1000 other things I could be working on that did have external pressures.
Parameterized reports
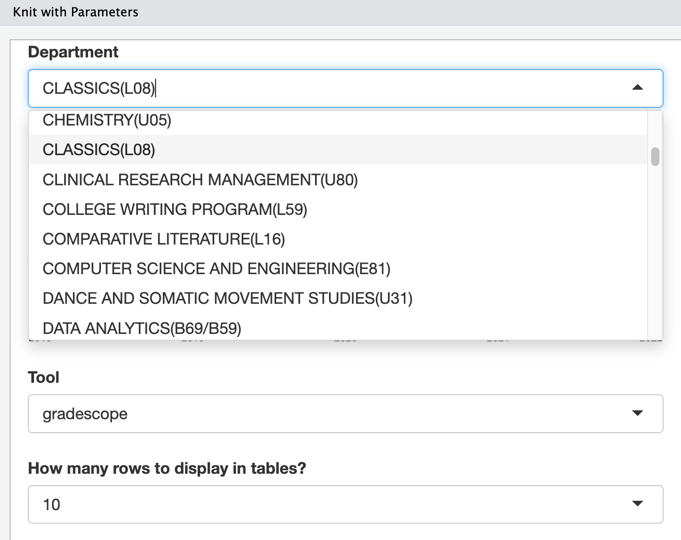
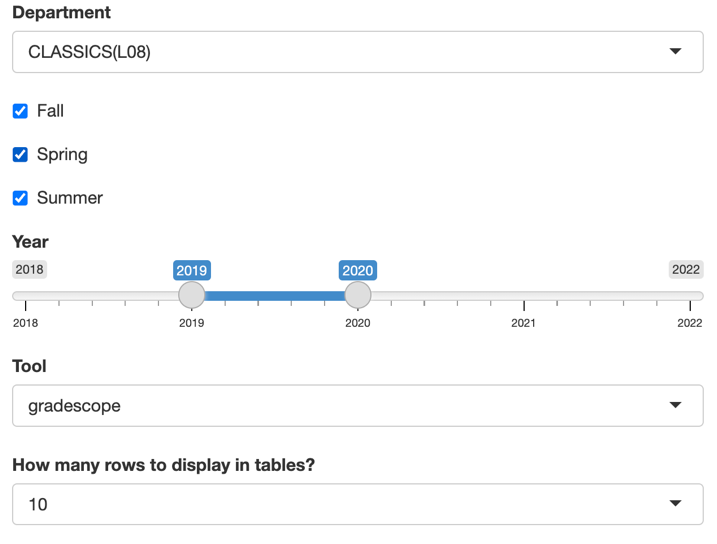
One of the projects I came up with was to create a parameterized report to produce a department-, time-, and tool-specific report. One challenge I faced with this project was that each tool’s data is structured differently so cleaning was required. As a one-person workflow team, one way that report could be improved would be to have a bigger, more structured workflow with dedicated wrangling and cleaning scripts. I think I was trying to do too much all in one place. In the end, I was able to use this report to provide the interested folks at University College with information on their use of a specific tool across their specified times. This was my first attempt at creating a dashboard without actually creating a dashboard. Check out my personal blog for a coming-soon tutorial on how to create parameterized reports!
This is what it looked like to make those selections (department, time, tool, report details):
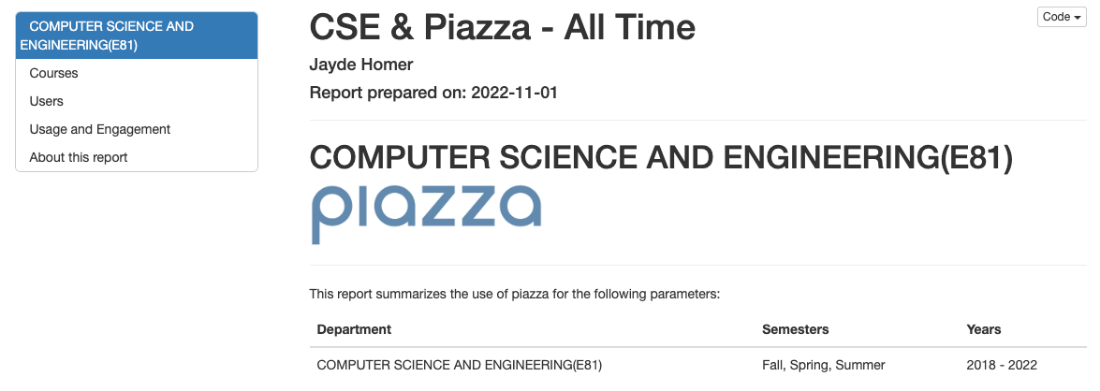
This is what the top of the report would look like:
I also worked on many other projects and reports that required lots of data wrangling and communication with vendors or stakeholders, both of which took time and often stalled progress. As this was an exploratory start to data analytics on our campus, this work was varied from trying different types of usage reports over time to a SoTL project that abruptly ended, mostly due to layoffs and reshuffling at a company we were working with.
After
There’s a reason there are whole degree programs for higher education administration. What a wild world it is. I’ve learned (or think I’ve learned) a lot about the structure of higher education administration teams and systems. There are like, a lot, of committees (aka advisory board, council, subcommittee, task force, advisory group, …). For everything. All at once. This means there are many opportunities to share findings and ask questions to people from all over the university. As a graduate student, we are often siloed. If you’re like me, you might attend some department events throughout the semester, see your lab or cohort-mates somewhat regularly, and sometimes make it to a school- or university-sponsored event. Attending various committee meetings allowed me to interact with a variety of members from the university and learn about all of the amazing work people do every day to contribute to advancement of the university and well-being of students.
After getting past the vast knowledge of all of the existing structures, I was very interested to learn about the relations between institutions and “vendors.” A vendor is a company that provides a service or product. The institution purchases licenses for faculty, staff, and students to use certain software, including educational technology. I was provided opportunities to communicate directly with vendor representatives to ask questions about data structure and have conversations about tool use. One thing I found interesting was learning about the different ways people conceptualize data depending on their role. In academia, we focus on truth, even if p > .05. However, when someone is trying to sell you a product, they’re going to do some funny things to their graphs. It was enlightening to see different versions and interpretations of the same data.
I also learned that there are so many people interested in these types of questions. In fact, there are entire associations dedicated to higher education analytics and information technology (e.g., EDUCAUSE). These types of associations are great resources for workshops and conferences, job postings and networking for those interested in higher education careers that are not teaching, and endless resources to expand your understanding of higher education’s role in our digital world.
While I gained a lot of “soft skills” in this experience, a few “hard skills” deserve much recognition: project management, programming, and data analysis. For me, these hard skills are where challenges arose, so that’s how I will frame them.
#1 project management
As I mentioned, the role was sometimes externally-driven by a deadline or need and sometimes self-driven. When things were self-driven, the work seemed a little harder because it didn’t always feel like I was actually doing anything. The first few times I did that, I felt like a failure and like I didn’t actually do anything. What am I going to tell my mentor? I have nothing tangible to show them when in reality I spent 2 hours cleaning messy data, performing exploratory data analysis, and making tables or figures to look for trends. While this didn’t result in a report, it resulted in questions and ideas that could be nurtured into becoming a full project or a report. One way to feel more accomplished was by using a “to-done” list. Instead of sitting down and working to accomplish a set of specified tasks, I would block out some time to just dig around, look for insights, and ask questions that were inspired by this poking about. When I the timer went off, I’d make a list of all the things I did. So, next time you’re in a position where you’ve already discussed setting SMART goals with your mentor, but nothing super tangible came out of it, then try a “to-done” list and practice giving yourself grace (something I’m pretty sure most graduate students don’t actually know how to do) if you didn’t “write dissertation” in that 2 hour work session.
#2 programming
Frankly, I wish I knew more Natural Language Processing (NLP) stuff. I think taking the time to make use of NLP would have benefitted me in some of the ways I was able to summarize findings from messy data. Some of the approaches I took instead were a little hacky, but I think they did the job okay. For example, in some of the data, courses are listed with the registrar name (e.g., FL2020.E81.CSE.131.11) which is nice and systematic. But in the same field, courses might be listed by whatever the instructor felt like putting in the field when they set up the tool (e.g., “Intro to Dinosaur AI”). The challenge this presented was making sense of these courses to extract department, semester, or school information when it wasn’t encoded elsewhere. To do this, I tried some fuzzy-matching techniques, but those turned out to be a bit too fuzzy, returning too many inaccurate classifications for my liking. What I ended up doing was writing a script that first determined what type of information was available and creating new values based on the structure that was available. Unfortunately, there were still hundreds (of the hundreds of thousands, so a relatively small percentage) of entries that my script could not parse. So, while this worked for that specific task, it was extremely time consuming to hand-code to check for specificity and impossible to implement at a large or reproducible scale given the lack of automaticity.
#3 data analytics
I would have liked to introduce more dynamic or interactive elements into my reporting. My attempt at parameterized reports was one attempt to do this. However, I think I had to accept the fact that dynamic reporting was beyond the scope of my role. I now know that Tableau would be a great way to produce these sort of reports that I had in mind.
General advice
Keep notes! Keep track of details, conversations, thought processes in different places. When coding, follow best practices for reproducibility (I like this for a crash course on what that means). For meeting and project tracking, that is a more individualized approach, but figure out what works for you! Whether that’s scrum, Kanban, pencil to paper note-taking, an ever-growing document in Word, Teams, or Notes, *figure it out.* It doesn’t have to be perfect, but document your successes and challenges. If something isn’t working, try to identify if there’s just one piece of that process that isn’t right for you, rather than trying an entirely new system or process.
Lastly, take care of yourself. As a graduate student and human you are pulled in a million different directions with a million different pressures on your shoulders every single day. Do not neglect your wellbeing for your work. The work will get done and you will keep aging in the process. Take care of yourself, in whatever way is best for you. For me that looked like finally admitting to myself that once I left campus and returned to my apartment, no more work would be done that day (my dog really helped dictate that rule!). It took a while to learn and respect that for myself, but once I did, things felt a bit better. I felt like I was nicer to myself. I know you came here to learn about data analytics, not be therapized, but I want to make sure you know that you can and should prioritize you.
Working with CTL was a unique and rewarding experience that fostered professional and personal growth. My mentor, Sally Wu, was always available to provide feedback, bounce ideas off of, or just have cool conversations about academic life. A big thank you to my other awesome supporters at CTL over the past five years, including Meg Gregory, Rick Moore, Eric Fournier, and Lisa Kuehne, who have helped me grow as both an educator and a data analyst.
Thank you for reading about my fellowship experience! I hope that my work and reflection here is impactful for future CTL fellows and graduate students considering academic adjacent careers.
As of November 1, 2023, I begin my new position as a statistical data analyst for Wash U’s College of Arts & Sciences Office of Graduate Studies. In this role I will continue making cool graphs, telling people stories with data, and learning new things every day.
Interview Details
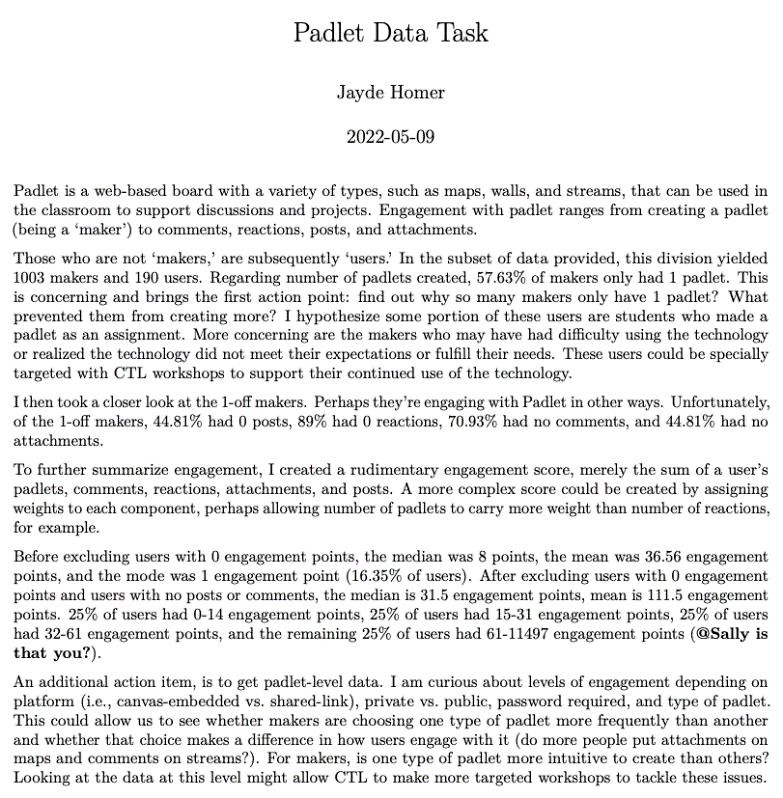
Data task assignment:
- Check out Padlet: https://ctl.wustl.edu/resources/padlet/
- Explore some examples: https://padlet.com/gallery
- Try it yourself: https://padlet.com/sally_wu/STLEats1
- Use the attached dataset of Padlet users to identify a small subset of “engaged” users who you would like to investigate further – however you define this category is fine
- Submit a PDF that is no longer than ½ of a page, with a summary of your process and 2-3 recommended action items
- Estimated time 30 minutes; no more than 1 hour
After playing around with the data in RStudio, here’s the report that I submitted: